01 The setting
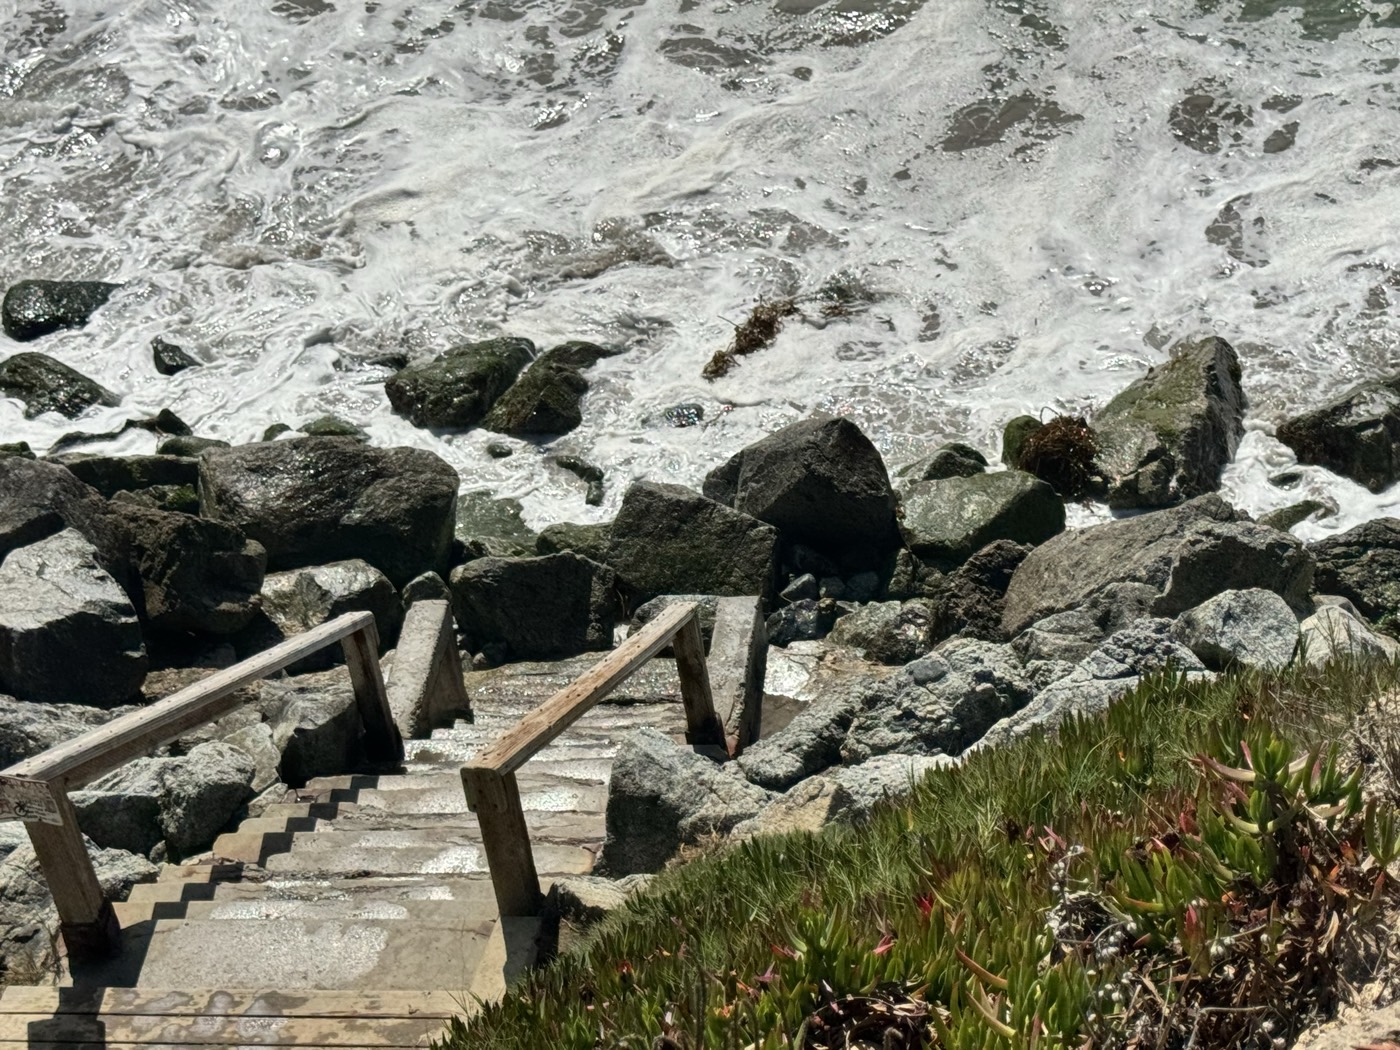
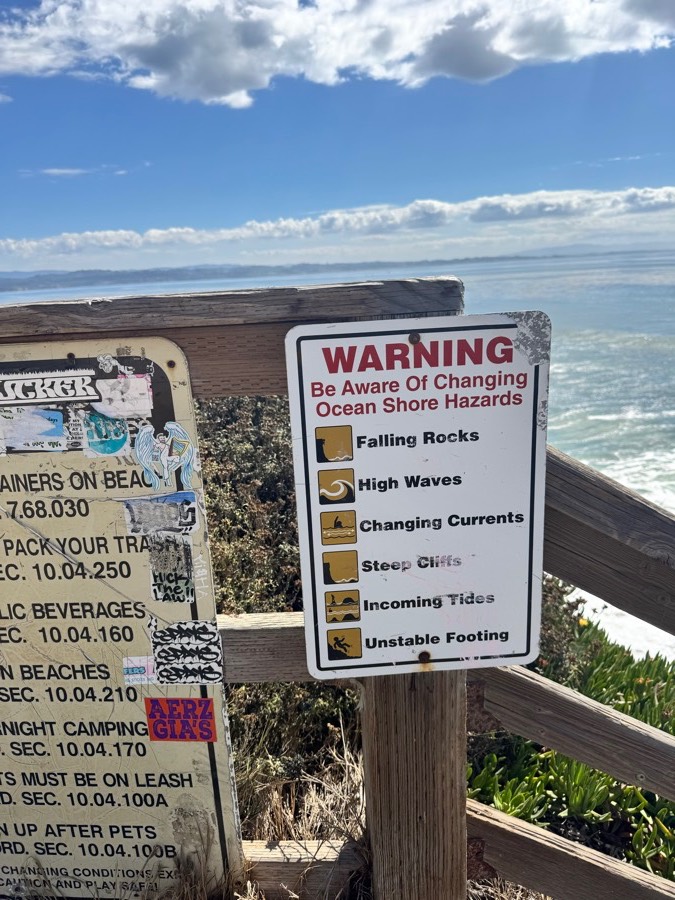
Pleasure Point is a rocky point on the east side of Santa Cruz, California, at roughly 36.954°N, 121.976°W, where the coastline turns a corner and runs east toward Capitola. The shore is a low marine terrace: a cliff of about 10–12 m fronted by a shallow wave-cut rock platform. The surf breaks over that platform, not over sand. Access is by stairs at 38th and 41st Avenues; the 41st Avenue stairs are The Hook County Park, 511 41st Ave.
Monterey Bay gives the point a wide swell window, so it works year round. Winter west swells arrive refracted and attenuated around the bay; summer south swells aim more directly at it. Because the coast rotates through the corner, one incoming swell meets the shore at a steadily changing angle, and roughly 1.6 km of shoreline carries a series of separately named breaks.
The place was named in the 1920s for a Prohibition-era speakeasy above the break. The surfing association came later.
02 The corner the coast turns
Local surf guides all state the same rule:
“the waves get larger, faster, and more powerful as you move up the point” — Sunny California, A Beginner's Guide to Surfing Pleasure Point
The OpenStreetMap coastline checks it. Walked as arclength from the apex, the coast tangent turns 112° over about 550 m, from −54.8° at Little Wind-an-Sea to +57.3° at First Peak. That turn, between Sewers and First Peak, is the point.
Past First Peak the tangent barely moves, wobbling around a mean of roughly 45–47° all the way to Private's, cusped by the little coves at the Hook. So angle alone cannot explain the down-point softening. Shelter and reef elevation do the rest.
03 The down-point gradient
A storm raises the whole point, but not evenly. Every spot receives the same offshore conditions; exposure, reef depth, and tide decide the local result. On a small day the active point contracts toward the exposed upper breaks. As swell builds, more of the sheltered coast switches on, and First Peak and Sewers get faster and heavier.
Private's and Sharks sit in the most sheltered water and require both swell and a low tide to activate at all (the model agrees in kind: its re-measured peel floors put Sharks at 0.46 m and Private's at 0.64 m of swell, holding only at or below mean sea level); the Hook and 38th occupy intermediate exposure; Second Peak sits on a low-gradient shelf and produces the long, roughly 90 m peel the site is best known for; First Peak's steeper profile yields tapered, faster walls; and Sewers, at the apex, is the most exposed of the seven and works on the shortest periods.
04 Breaking character along the point
The first two figures come from survey data. The third is renders, regenerated on 24 September with the current preset bank. The frames first ran the original peel-angle bank, translated from surf-guide language (“mellow”, “softer-breaking”, “longboard-favored” became α = 58–70° at the down-point spots) because no one had published a measured peel angle for this coastline, or for any Santa Cruz break. Checked against the refraction physics the model itself implements, five of those seven numbers were too high to be real, and in mid-August 2026 the bank was retargeted to each spot’s own physical ceiling: the current bank runs 31–50°, and the mellowness the guides describe now rides in an explicit sheltering field rather than the angle. Section 07 walks through the whole arc, from translation to refutation to retarget.
All seven run on surveyed NCEI bathymetry through their OSM surf node. Private’s was the exception until 2 September: its stretch of coast defeats the cubic contour fit over the full stage (16.5 m RMS), so it now runs on a truncated contour window (1.87 m RMS) rather than a synthetic stage, and the app names the window.
One thing the contour map cannot show is how flat that floor actually is. Measured against its own least-squares plane — fitted to the submerged platform only, cliff excluded — the seabed at Second Peak deviates by 0.32 m RMS: decimetres of texture on a 1:58 ramp.
That matters because a peel is an angle, not a lump. In the deliberately simple counterfactual below, the breaking route follows the mean depth contours while the crest arrives at whatever angle refraction leaves it; the two are only 6° apart. The actual point-break route can be oblique to those contours, which is why this figure diagnoses the ramp rather than defining every peel the model may draw.
05 The simulation work in progress
This section is a real-time WebGL model built on the data above, and it is unfinished. It is here because it makes one claim testable: if the shape of the seabed sets where a wave breaks, replacing the seabed should change the wave. That is the standing optimization of the whole project — explanatory and demonstration power. Walking the line between simulation and aesthetic recreation is not a tension to be managed; it is the product definition: physics owns the field, authorship owns the character, and a frame earns its place by showing the mechanism that produced it.
The model is kinematic, not a fluid solver. A phase travels along a break line, and the seabed supplies water depth. Depth then drives shoaling by conservation of wave-energy flux (Ks = √(cg0/cg)), using the finite-depth linear group velocity from the same dispersion relation as the crest phase rather than substituting its shallow-water limit at every depth. It then applies depth-limited breaking at H = min(H0Ks, γh) with γ ≈ 0.78, and a shoreline wherever depth crosses zero. None of it has been checked against a measurement of this break.
What makes a point break tractable at all is that its defining motion is geometric. The breakpoint — the spot where the wave is actively folding over — travels along the crest at Vp ≈ c / sin(α), where c is the wave speed and α is the peel angle: the angle the advancing whitewater front makes with the unbroken crest, in Walker’s 1974 formalism. At α → 0 the whole line breaks at once — a closeout, Vp unbounded. At α = 90° the breakpoint moves at exactly wave speed, the slowest peel there is. Every judgment on this page about “fast” or “mellow” water is a statement about that one angle.
Two more standard relations sit underneath. Dispersion sets the speed: ω² = gk tanh(kh), which in shallow water collapses to c = √(gh) — waves slow as the water thins, and the slowing is what makes them grow. And because speed depends on depth, Snell’s law (sinθ/c constant) bends every crest toward shallow water, so crests arrive nearly parallel to the depth contours regardless of how they started. On a shelf tilted against the swell, one end of every crest is always in shallower water than the other: the break criterion is met at one end first, then progressively along the line. That progression is the peel. The model’s job reduces to drawing that locus where the depth puts it.
At runtime none of this is solved as a fluid. The model bakes a break line — the locus over the measured bed where shoaled height first exceeds the depth ceiling — and every crest that crosses it produces a traveling breakpoint with no per-wave state: green face ahead of the crossing, an active pocket at it, decaying whitewater behind. Whether that pocket spills or throws is a second, independent knob: the Iribarren number ξ = tanβ / √(H/L₀), which depends on bottom slope, not peel angle — a wave can peel slowly and still plunge. Sets come free from beating: two swell components a few millihertz apart make a group envelope with period 1/Δf — about 124 s at the settings here, measured in-app.
One implementation detail turned out to be physical, not cosmetic. The mesh moves water horizontally to sharpen and overturn the crest, but the phase, breaking permission, lifecycle and foam age belong to the water sample before that displacement. Terrain, lighting and fog belong where the sample ends up. The renderer now carries both positions. Before that split a point shifted as much as 20 m could ask a neighbouring wave whether it had broken, which detached bright plates from the peel head even when every individual mechanism was behaving as written.
One editorial rule governs what the reef may add. The measured seafloor decides where waves break, but 10 m bathymetry carries 0.3–0.9 m of survey residual, and on slopes this gentle (1:58 at Second Peak) that noise displaces the break line by tens of metres — enough to invent A-frames the real point does not have. So each mapped site adds one declared component: a planar wedge in Mead & Black’s (2001) taxonomy of surf-break bathymetry, fitted — over its crest depth and its strike — toward that site’s target character. Since 24 September the crest may sit in the intertidal (a shelf that dries at the lowest tides, as the real platform does), because the only measured peel the project has (15 August) broke in water the old submerged-only rule could not reach. The declaration is bounded — the physics still proposes every candidate break position; the wedge only chooses among them — and the plane counterfactual below removes it along with every other bump. What the model may author and what it must derive is a recorded rule in the repository (MODEL.md §4.5, with the intertidal decision in §4.6), not a habit.
The test is a counterfactual. Below, the same swell runs over the same site twice: once over the bed the model draws — the surveyed seabed (0.32 m RMS of its own structure at Second Peak) plus the declared wedge — and once over that seabed's least-squares plane, identical in mean depth, slope and orientation, with the survey's structure and the wedge both removed.
Until September the result was that almost nothing happened: the two frames differed by about 1% of full brightness, because the wedge then sat 2.1 m below sea level and the survey's own relief was all that was left to remove. After the refit the wedge crest at Second Peak sits 0.86 m below mean sea level, and the same comparison, at a fixed camera, differs by about 9% of full brightness: over the plane the swell breaks in shore-parallel rows, over the drawn bed it breaks first at the apex and peels. The shoreline is unchanged at the tide shown (mean sea level); at the lowest tides the wedge crest breaks the surface as a shelf, which the plane also removes. Four Sentinel-2 frames say the same thing from orbit: the plane bed puts the break 84–184 m inside the observed whitewater at the apex, the wedge does not.
The mechanism is the geometry. What sets the peel is the angle the depth contours make with the arriving crest — 6° on the survey's own plane, per Fig. 4 — and the plane preserves that angle by construction: same mean depth, slope and orientation. The counterfactual removes the relief, and at this site the 10 m grid carries only 0.32 m of it, which is why the survey alone never made the wave peel. The declared wedge is the relief the grid cannot see: a crest 0.86 m under the surface, struck 44° off the shore, that bends the contours where the point actually is. Removing it is what turns the peel back into rows.
A cross-section overlay draws the two competing curves: H0Ks against the depth ceiling γh. Moving the tide slides their crossing point along the profile while the breaking depth stays fixed. γ sets the depth; the bed decides where that depth is.
Known limitations
- Not validated. Until 23 September no comparison against a measurement of this break had been made. The first ones now exist and are recorded in the repository’s fidelity audit: four Sentinel-2 frames against the baked break line, one photograph at a solved camera pose, and one afternoon of surf-cam peel kinematics. They found the mirrored scene and the too-deep wedge that section 05 describes, and they fall short of validation: no measured wave height, no breaking position at known forcing on more than one day, and a camera focal length nobody has solved. Section 07 explains why the usual reference data does not exist to compare against.
- All seven sites are mapped, on an interpolated seabed. Sewers, First Peak, Second Peak, Jack's (38th), The Hook, Sharks and (since 2 September, on a truncated contour window) Private's use surveyed profiles. None of the public grids has a sounding under the surf zone itself; every wedge is labelled synthetic in the app.
- The break line is derived, and the reef is now fitted against it. The runtime reports signed peel as the angle between the baked breaking route and the refracted crest, and since 24 September each site's wedge is fitted against that same quantity, over crest depth and strike, with one measured field day as a constraint. What did not close is on the record: Second Peak's card state reads 32° against its 41° target, the most the wedge that carries the field day can give. The pre-refit reef remains in the app as #reef=legacy.
- Tidal datum is approximate. Depths are NAVD88; the conversion to local sea level (0.905 m) comes from NOAA station 9413450 at Monterey, about 40 km away, because the Santa Cruz gauge publishes no NAVD88 relationship.
- Underwater visibility is exaggerated for legibility. Real visibility here is a few metres.
- Wave height is exaggerated relative to the terrain, deliberately: true heights are close to invisible at landscape scale.
Source, data-processing scripts and the model description are in the pointbreak repository. The figures above are generated from the same committed data files the simulation reads.
06 The curl current renderer
Everything above is a height field: one water surface for every point on the seabed. That is enough for shoaling, refraction, and deciding where the wave breaks — and it is structurally incapable of a barrel. An overhanging lip is not a function of position: under the lip there are two surfaces at the same point on the floor, the thrown water above and the face below. The model’s forward pitch (a phase skew) can lean the face toward vertical and can never pass it, because no reparametrisation of a single-valued height is multivalued. Getting past vertical takes a second mechanism.
One comes free. The renderer’s choppy displacement slides each grid point horizontally toward the nearest crest, and the whole term collapses to one number: write S = λ·a·k² and the surface tangent at the crest goes vertical at exactly S = 1 — the cusp. Past it the mesh genuinely folds; at Sewers it reaches S ≈ 1.8. But the fold is symmetric about the crest, throwing water seaward exactly as much as shoreward. That is a cusp with a hood on it, not a wave pitching over its own face.
The first solution added a throw (translate the crest band shoreward) and a drop (pull the front face down). From the lineup they mostly worked, but a translation cannot preserve thickness: the translated crest is still the same zero-thickness sheet, somewhere else. Its magnitude also carried no length of the wave’s in it. Rewriting the bound against the cusp length S/k cut fold points 41–56% across six Sewers clocks without moving crest height, but it could not turn a translated sheet into a volume. That path remains available as one reversible old-renderer URL; it is no longer the default.
The cure for the thin shell is a bend, not more throw. A plunging lip curves forward onto an arc: water above a bend line at 0.35·hcrest travels through arc angle θ = dy/R, with the radius set by the wave’s own height and its Iribarren number. Three properties are why it is this deformer and not another. It never lifts — no vertex ends higher than it started, so the crest lowers as it pitches, which is what a real one does. It preserves arc length — the band keeps its thickness, a tube with volume rather than a sheet. And it overhangs by construction wherever the face is steep, without being asked. A rigid rotation was tried first and falsified: a rotation has a pivot, therefore a lever, and it lifted the crest into a flat-topped slab standing 41% over the depth-limited ceiling. A bend has no pivot.
Character comes out of one number, with no per-site tuning: at Sewers (ξ 1.15) the bend reaches 132° of overturn — its mesh backstop — while Sharks (ξ 0.45) moves 12°. Spilling barely overturns. That is the same barrel knob the foam machinery reads, arriving at the same answer through geometry.
The bend overhangs, but a bend alone does not close. A real plunging lip is joined to the face by a falling curtain, and the space the curtain encloses is the barrel. Without it the overhanging band is a sheet in the air with open water visible underneath — measured on the default path before the repair as 21 of 279 overhang bins carrying foam-bright water over bare water, the worst gap 7.67 m of nothing. The curtain is now built the same way the rest of the model is: both of its edges are evaluations of the shipped surface — the top at the lip the bend actually draws, the bottom on the face ahead of it — joined by a curve that leaves the lip tangentially and only hangs as much water as the overturn has earned. Where nothing goes over, nothing hangs: at Sharks the curtain changes not one pixel.
On 26 August the pieces became one default renderer: the bend, aerated lip, connected curtain, causal development behind the travelling head, and a smaller approach sharpening term (Sapp = 0.22). The order matters. The onset window stops fully developed overturn appearing ahead of the zipper, while the weaker approach stops proximity to the break line from sharpening that unbroken water into a plate. A deterministic matrix over all seven presets removed the detached bright head without adding a mapped-site failure, and a live review promoted the bundle. Every old value remains available in the URL for a direct A/B.
Shape was only half of the event. The first promoted version held most of its bend after onset, so it looked posed rather than thrown, and a foam clock intended to soften the carrier’s seam was also rejuvenating whitewater on the side the travelling breakpoint had not reached. On 28 August those clocks were separated. The curl now starts slowly, accelerates into impact at 0.42 s, and releases into splash and spray; the broad foam wake remains behind the crossing while only a compact, wavelength-scaled aerated edge leads at the lip. The visible order is now lip, crash, wake — not foam chasing the wave from the wrong side.
This is a staged breaking event, not a fluid solve. Its ordering and attachment are now explicit, but the splash remains a kinematic burst rather than transported crash mass. The next visual problem is therefore not another lip tune: it is a roller and foam state born at curtain contact, moving with the broken wave and leaving a coherent wake. From inside the tube the curtain also still closes the void only partially. The optional look=foam material remains unpromoted.
The next piece is not another tune of the height field. It is the cross-section the height field cannot hold, built as its own curve. Take one alongshore station and look at it from the side. Four numbers describe the crest as the lip pitches: its height hC, set by the depth limit; the phase speed c, set by the depth through dispersion; the Iribarren number ξ; and the age of the break at that station, in seconds since the crest crossed the break line. The lip is water launched from the crest at about the phase speed and falling under gravity, so its path is a parabola and its horizontal reach is c·√(2hC/g): a faster or taller crest lands further ahead, with no constant fitted to make it so. ξ decides how much of the crest goes over and how round the cavity behind the jet is; below the Battjes spilling threshold nothing goes over and the curve draws no cavity at all. Impact sits on the same 0.42 s clock the foam and spray already use, and after it the foot stays put while the upper edge clears into a bore.
This is a family of shapes, not yet the renderer. Sweeping it along the break line and seaming it into the grid at both ends is in progress. The Second Peak footage also says the site rarely needs the round end of the family: the lip there crumbles more often than it throws, and the crash the camera records is a section shutting, not a barrel closing.
07 The numbers nobody has measured
The single most important parameter in this model is the peel angle α — the angle between the breaking edge and the unbroken crest, the thing that separates a peeling wave from a closeout. It has a sixty-year-old formalism (Walker’s 1974 Look Laboratory work in Hawaii defined it, and put the surfable floor near 30°). What it does not have is data. A 2026 literature search, run for this page, found no published measured peel angle for Pleasure Point, Steamer Lane, or any Santa Cruz break — not in journals, not in theses, not in agency grey literature.
The gap is not for lack of looking at this coastline. In 2006 the USGS pointed a camera at this exact reef and left it there for a year (Open-File Report 2007-1270), under a task named “Spatial and Temporal Variation in Breaking Wave Patterns”. It collected 30,317 eight-megapixel stills of five named Pleasure Point breaks and 12,744 averaged video frames, alongside a wave gauge in 14 m of water and a swath-sonar survey of the reef far finer than the public bathymetry this page runs on. Nobody computed a break-line orientation from any of it. The 2025 Save The Waves climate-vulnerability study of 31 Santa Cruz breaks mentions peel angle exactly once: as a line item in a recommended template for future assessments. The California Coastal Commission’s permit conditions for the Pleasure Point seawall require permanent monitoring of “wave break character” — a term the findings never define. The wave every local can describe has never been measured in the one unit that describes it.
The gap is not for lack of a tool, either. The method exists, and it has already been run on this coast. For the Topanga Lagoon restoration EIR, Integral Consulting ran a wave-resolving XBeach model of Topanga Point on a 5 ft grid, thirty-five minutes of simulated ocean per scenario, and extracted a peel angle for every breaking wave: composite the whitewater from the largest third of the waves into a break line, digitise each crest where it meets that line, take the angle between them (Integral Consulting 2023, in the project’s draft-EIR appendices). They reported it the way a point break demands — as a profile down the point, sectioned by the landmarks surfers actually navigate by: the turning point, the restrooms, the second stairs. The Santa Cruz study was asking a different question — how often each of thirty-one breaks is surfable at all, which is an availability measure and the right one for a climate-vulnerability assessment — and it answered that one. So the technique is proven on this coastline. It simply has not been pointed at this reef yet.
For measured point breaks anywhere, the published record is one wave. At Raglan, New Zealand, Scarfe digitised a single ride from rectified video frames and got α = 0, 48, 50, 69, 22, 69, 45, 30° at one-second intervals (Scarfe, Healy & Rennie 2009). Read the shape of that series: the wave swings through the entire range this page assigns to seven different breaks — within eight seconds of one ride. The 69° readings are the escape sections that let the surfer out of a barrelling closeout, alternating with 22–30° runs. A peel angle is not one number per break; it is a distribution, and nobody has published the distribution for anywhere in California.
Against that near-empty record, the guides were this page’s first source: “mellow”, “softer-breaking” and “longboard-favored” became 58–70° at the down-point spots. A straight-contour counterfactual objected. If the breaking route follows parallel contours, the peel angle equals crest incidence at breaking and Snell’s law bounds that incidence: sin αmax = cb/cs — the ratio of wave speed at breaking to wave speed where refraction begins (Henriquez 2004, TU Delft). No reef dimension appears in that bound. Making the reef bigger makes it worse: a deeper wedge gives refraction more room to work, which is why reef designers rotate larger reefs further off the swell rather than building them steeper (Mead 2000). On this model’s own dispersion code the counterfactual lands at roughly 35–54°, in the same band as Topanga’s 31–53° section averages. That made it a useful warning against the original 58–70° bank. It is not a universal validity bound on point-break peel: at a real point the breaking route can be oblique to the contours, and peel is the signed angle between that route and the crest. An earlier version of this essay promoted the straight-contour incidence bound into the authority for every route. That was too strong.
The retarget still made a good editorial correction. The bank now asks for 31–50° rather than treating “mellow” as an order for an extreme angle, and a separate sheltering field carries the smaller, weaker down-point waves. What changed again on 26 August is the instrument, not those authored hypotheses. It now differentiates the baked phase along the breaking route and reports a signed crest-relative peel plus breakpoint velocity; the old atan(|dzb/dx|) is retained only as a named line-bearing diagnostic. The result is less flattering and more useful: off-reef reversals and limiter-pinned stations remain. For a month the synthetic reef stayed calibrated against the old bearing because a direct refit against the new metric made Second Peak reverse through a closeout. That investment was made on 24 September, after the first day of measured peel kinematics (a fixed surf cam on 15 August: 4.7–6.7 m/s down the line at Second Peak, where the model then drew a closeout) showed the wedge could not reach the water the real wave broke in. The refit is over crest depth and strike, scored on the signed crest-relative peel, and it reproduces that day; what it cannot give is Second Peak’s full 41° at the card state: 32°, the most the wedge that carries the field day allows.
The measurement itself is now tractable, which is the invitation this section ends on. Two published methods extract peel angles from exactly the kind of imagery that already exists for this break: wave-peel tracking from camera frames (Thompson, Zelich, Watterson & Baldock 2021) and a neural-network detector that has logged ~1.6 million breakpoint-and-crest pairs at Manu Bay (Atkin, McIntosh & Bryan 2022). The USGS archive pairs a year of Pleasure Point shore-camera imagery with surveyed bathymetry; the raw material for a measured peel-angle distribution in Santa Cruz is sitting in public archives. This project’s own first measurement is one afternoon of a fixed surf cam (15 August 2026): peel speed 4.7–6.7 m/s at Second Peak, with the angle bracketed 55–73° by a focal length no one has solved. Until the archive is run, every α on this page is a hypothesis, and is labelled as one.