Inside the Break · No. 1
Twenty-One Seconds
Why a 21-second swell made 40- to 60-foot waves at Mavericks on 14 November 2026, worked out from NOAA buoy, weather-model and seafloor data.
At 10:10 UTC on 14 November, 02:10 in California, NOAA buoy 46042, 50 km west-northwest of Monterey, measured swell 9.7 metres high with crests 21 seconds apart. The day before, the period there had run 13 to 16 seconds.
Period decides how a swell travels and how a reef handles it. A 21-second wave is about 690 metres long in deep water and crosses open ocean at 59 km/h. It starts to feel the seabed 340 metres down, so the continental shelf and the reef off Pillar Point have tens of kilometres in which to slow it, turn it and gather it. Later that morning, surfers at Mavericks were towed into faces of 40 to 60 feet.
1 · El Niño
El Niño and the storm track
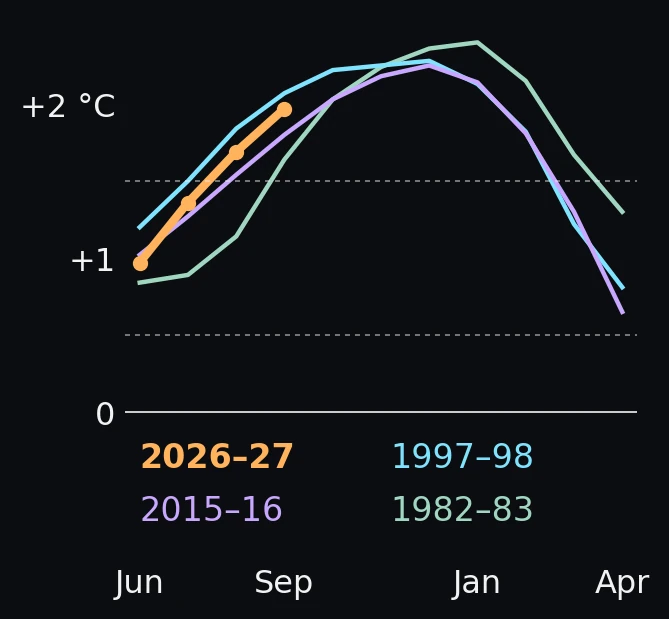
El Niño is a warming of the surface of the eastern tropical Pacific. On 12 November, NOAA's Climate Prediction Center reported the Niño-3.4 index at +2.5 °C. It put the chance that this event passes every El Niño since 1950 at about 60 percent.
In strong El Niño winters the North Pacific storm track reaches unusually far south. The 1997–98 El Niño winter had the most wave energy across the northeast Pacific in the 1981–2003 buoy record. In 2015–16, winter wave energy along the US West Coast equalled or exceeded its measured maxima.
Mavericks needs that kind of winter. The 2007 seafloor mapping found that the usual northwest swell is mostly too small to break there. It takes large, long-period waves from a more westerly direction.
The math: which index, and what it cannot say
CPC now leads with the relative Oceanic Niño Index (RONI): the Niño-3.4 sea-surface temperature anomaly (5°N–5°S, 170°W–120°W) minus the anomaly averaged over the whole tropics (20°N–20°S). It is rescaled to the traditional index's variance. As the tropics warm overall, the plain anomaly drifts upward, and the relative index keeps 2026 comparable with 1982 and 1997.
At their peaks, 1997–98 reached 2.28, 1982–83 2.40 and 2015–16 2.25. The traditional index for August–October 2026 reads +2.46 °C.
An El Niño changes the odds of storms like this one. No single swell can be attributed to it, including this one.
2 · The storm
A storm moving at the speed of its swell
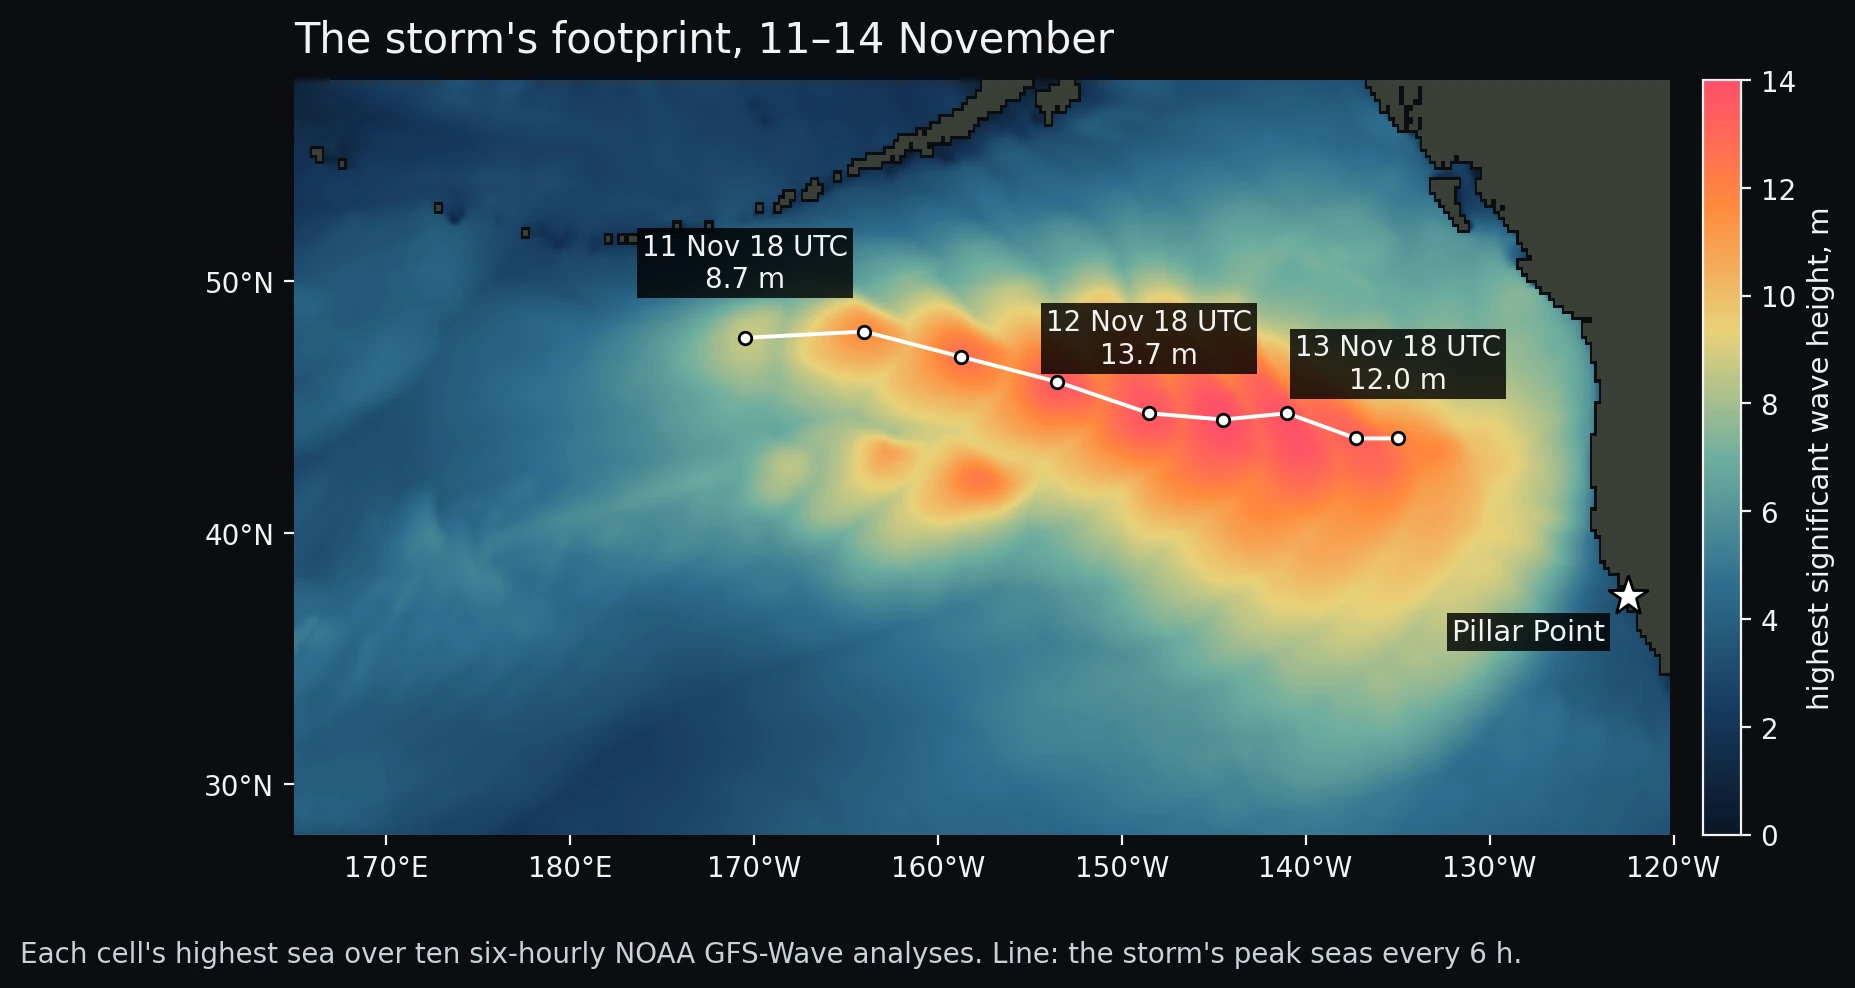
NOAA's global wave model first shows the storm's seas late on 11 November near 48°N, 170°W, south of the Aleutians. Over the next two days its highest seas moved 2,280 km east-southeast at about 54 km/h and grew to 14.1 metres (46 feet).
54 km/h is the group speed of 19-second swell, and Monterey's peak period on the 14th was 18.9 seconds. A storm that moves with its own waves keeps its wind on them for the whole crossing. Forecasters call this a trapped fetch. It produces the largest waves, and they arrive without the usual early run of long-period forerunners. At the offshore buoy, energy at 20 to 25 seconds went from a trace to its peak in about five hours.
The math: speed, and a check from one buoy
Swell energy travels at the group speed, which in deep water depends only on the period:
Long waves outrun short ones, so after the onset the lowest frequency at a buoy climbs over time, and its rate gives the distance to the source (Barber and Ursell, 1948). At the offshore buoy 46059 it climbed 0.79 mHz per hour (r = 0.95), which puts the source about 3,500 km away around 00 UTC on 12 November. The model agrees on the time; its storm was 3,000 km from the buoy then. The estimate's position is about 900 km off, because the method assumes a storm that stays put.
The track is the cell with the highest significant wave height inside 38–56°N, 130–175°W in each 0.25° analysis. It is a model analysis, constrained by observations.
3 · The biggest wave in a set
Buoy height and the biggest waves
Buoys report significant wave height, the average of the highest third of the waves. Monterey's peak was 9.7 metres (32 feet) at 15:20 UTC on 14 November, 07:20 local time.
Individual heights in a sea like this follow a distribution with a long tail. A three-hour session brings about 635 waves, and the expected largest is 17.5 metres, or 57 feet. That falls inside the 40 to 60 feet reported at the reef.
The math: the Rayleigh tail
Longuet-Higgins showed in 1952 that wave heights in a narrow-band sea follow a Rayleigh distribution. The expected largest of N waves is approximately
A buoy measures trough to crest in deep water. A photographer's "50-foot face" is read off the wave as it stands over the reef, against a rider whose height is known. The two measures are related but not equal.
The shape
4 · The reef
The reef under Mavericks
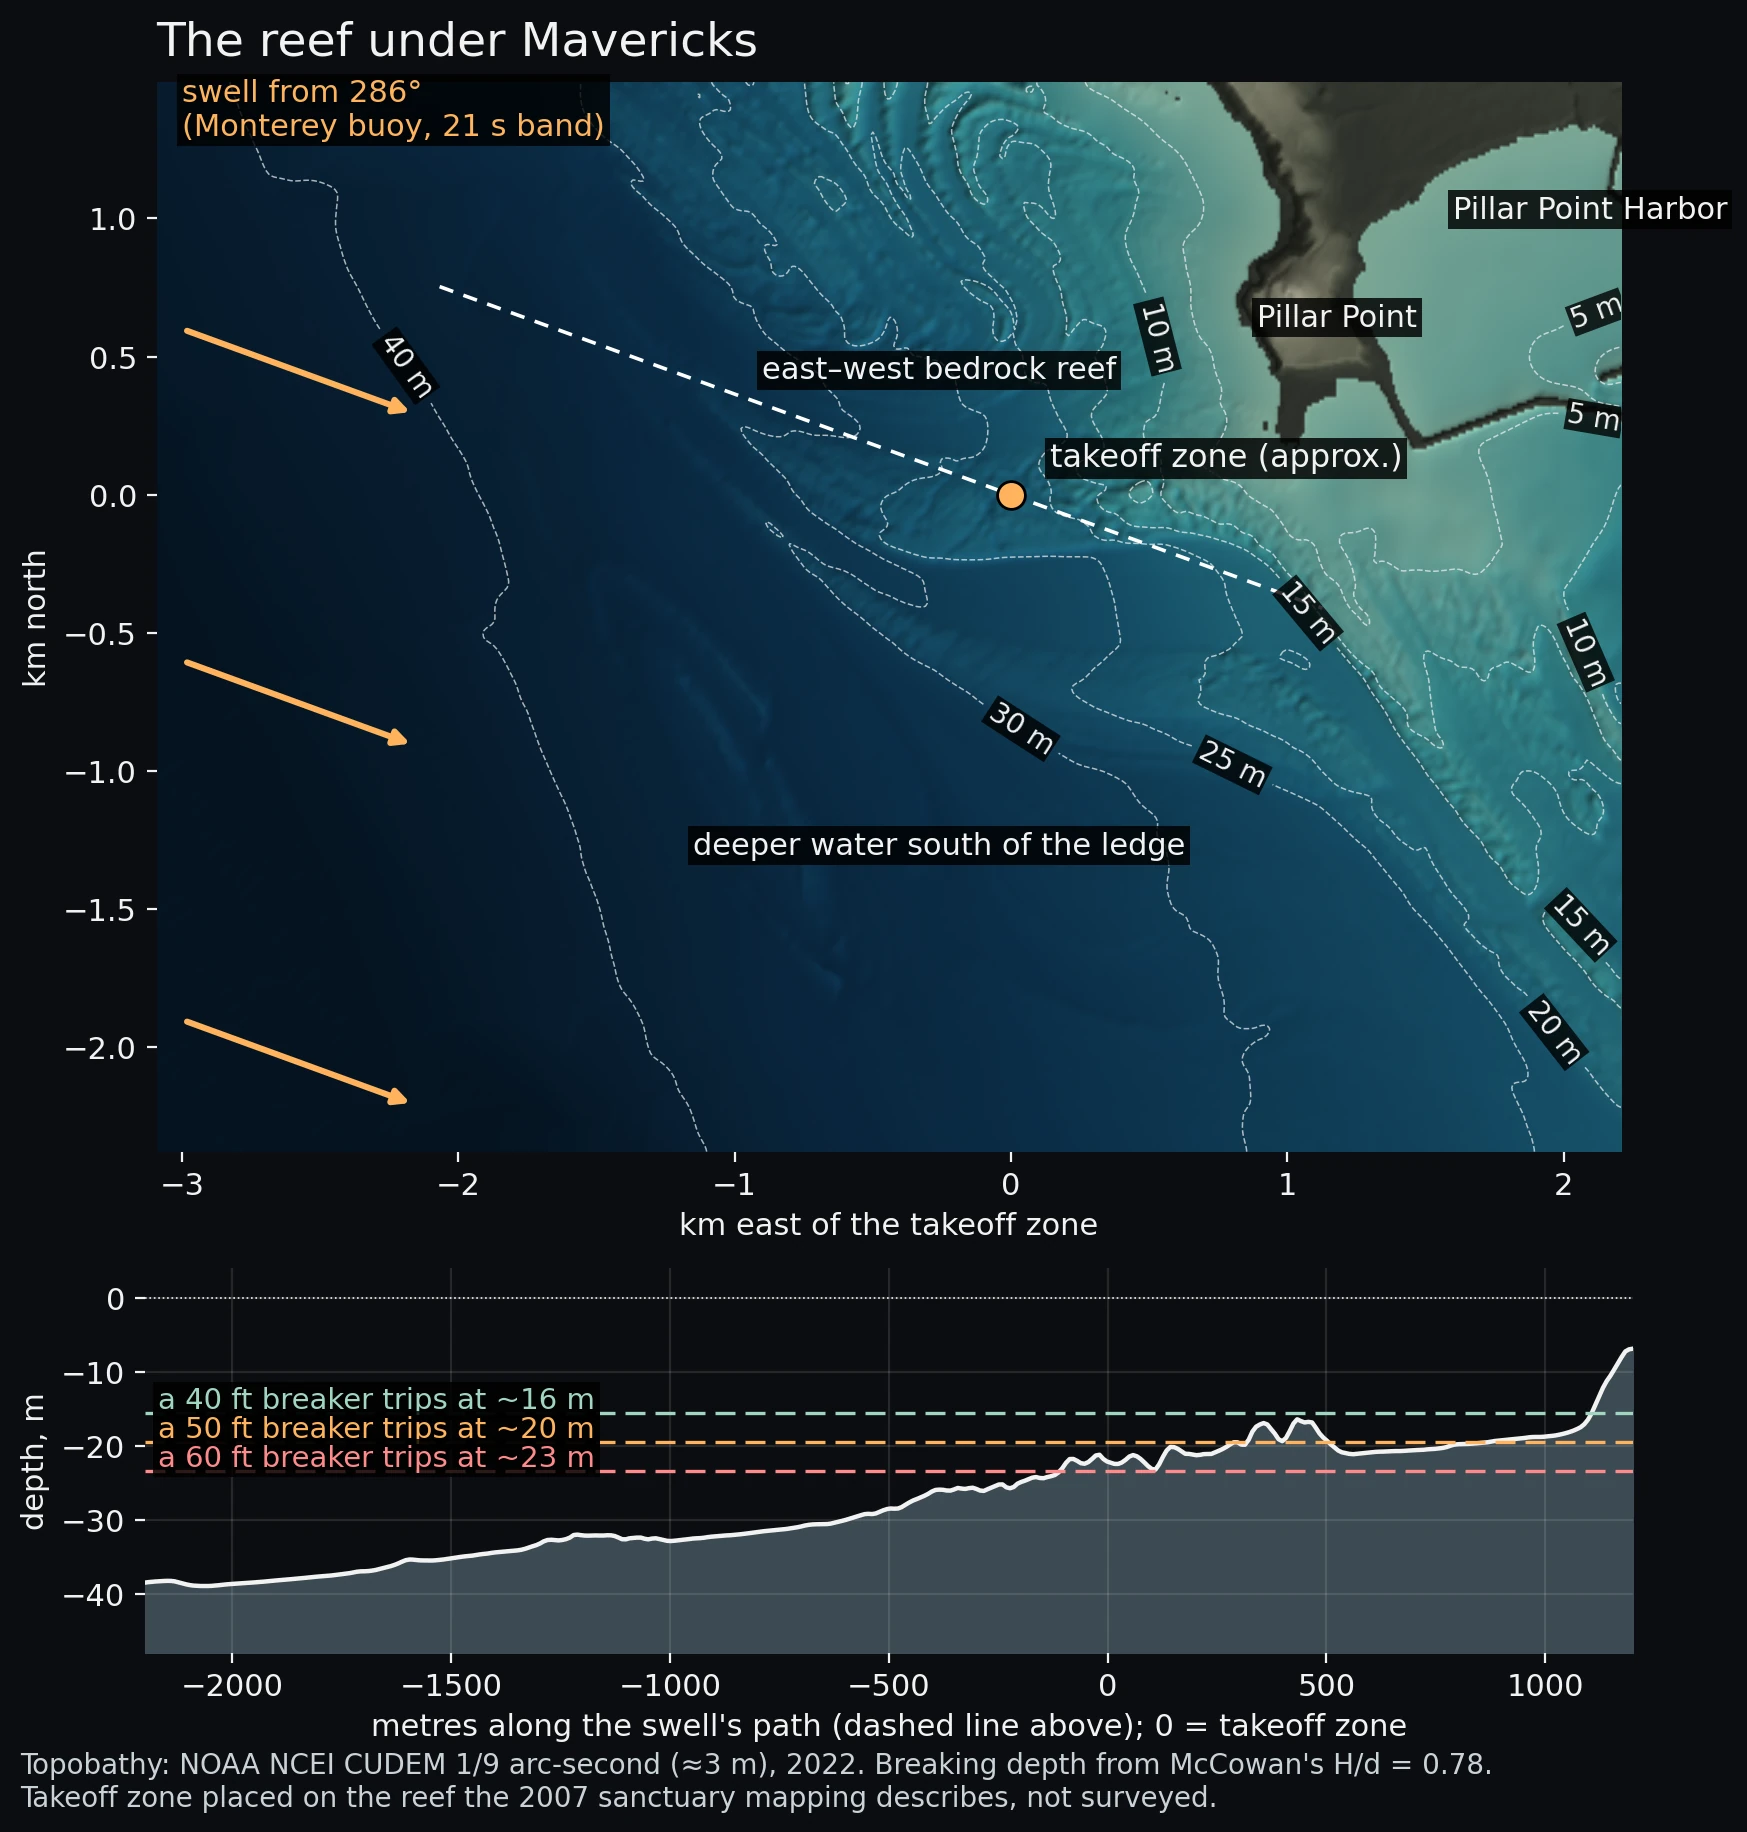
A wave breaks when it grows too tall for the water under it, at a height of roughly 0.78 times the depth. A 50-foot wave therefore breaks in about 20 metres of water and a 60-foot wave in about 23. By then a 21-second swell's crests are about 290 metres apart, less than half their deep-water spacing.
NOAA's 3-metre seafloor model shows a ridge of bedrock running east–west off the point. Along the swell's path the bottom rises from 39 metres two kilometres out to 33 metres one kilometre out, then to about 22 metres at the edge of the ridge. That is the depth at which waves of the reported size break.
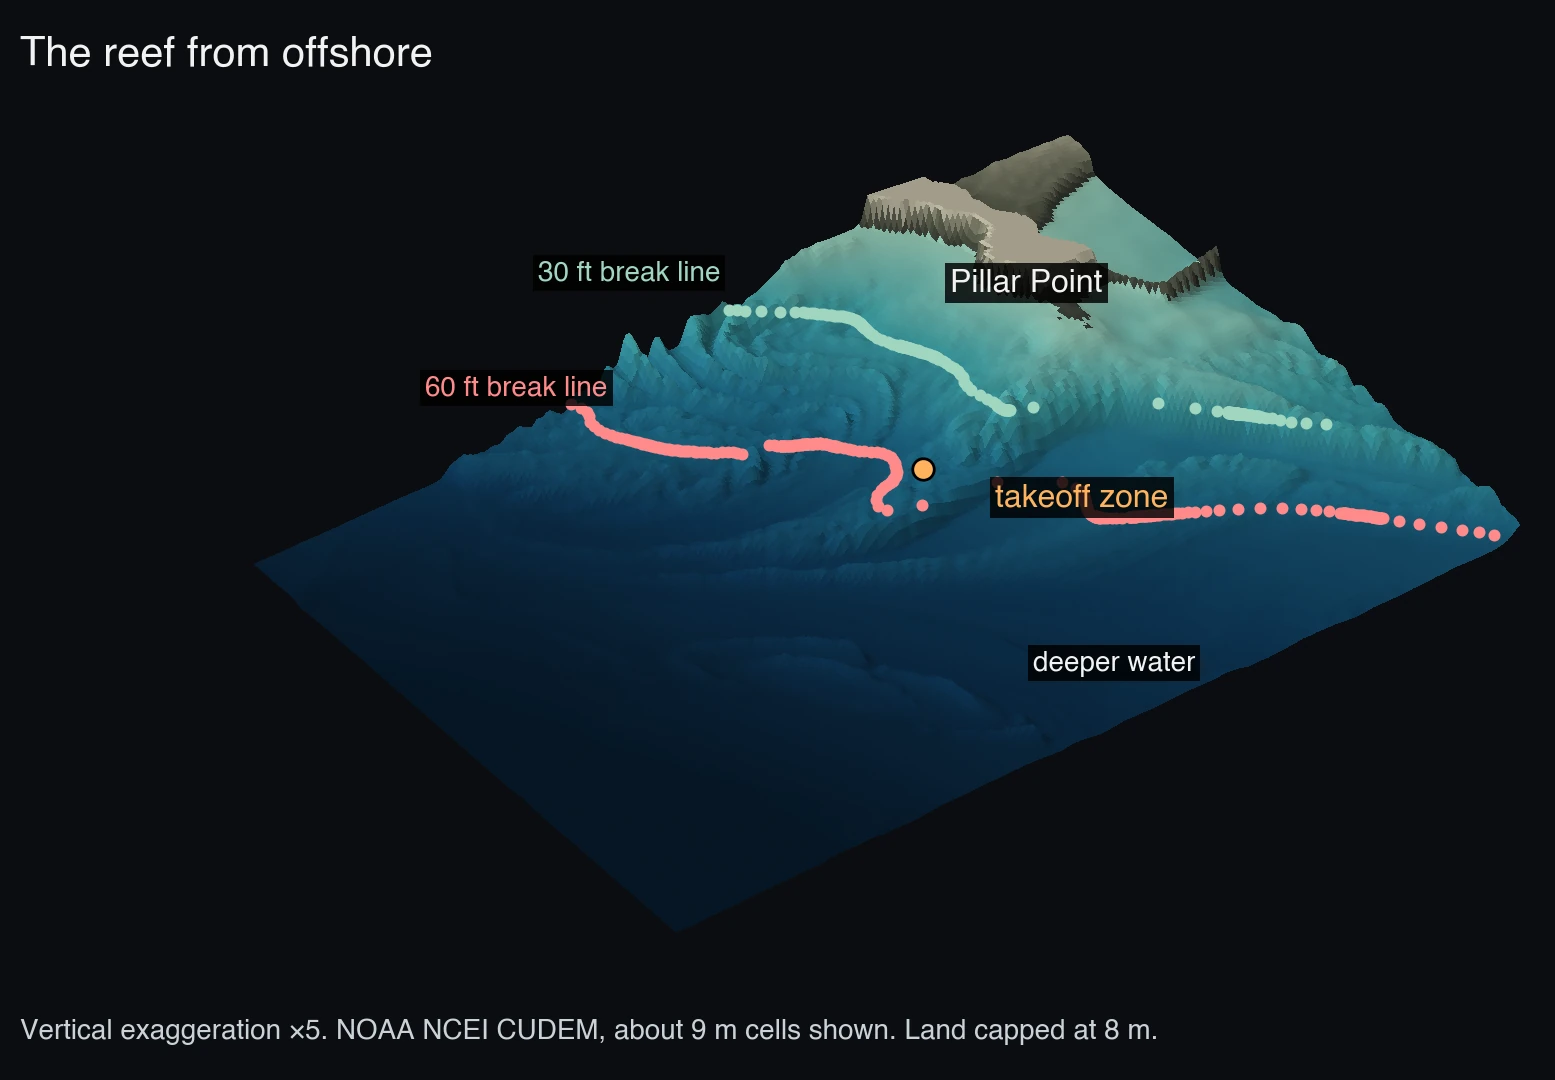
Seen from offshore, with the vertical scale exaggerated five times, the reef is a series of parallel ridges running out from the point. They are the edges of tilted sedimentary beds, folded by movement on the San Gregorio fault, which comes ashore in Pillar Point Harbor. Mavericks sits on one of those ridges, a promontory the 2007 mapping describes as focusing wave energy.
The math: wavelength, breaking depth, shoaling
Shoaling alone adds little: a 21-second wave reaching 20 metres of water grows by about 12 percent from the change in depth. The 0.78 ratio is McCowan's limit for a solitary wave on a flat bottom. Real breakers on a reef run a range around it, so the breaking depths are approximate.
5 · Size and slope
Bigger waves break farther out, on gentler ground
Each wave size breaks at its own depth, so each meets a different part of the reef. Along the swell's path through the takeoff zone, a 60-foot wave breaks on the outer edge of the reef, where the bottom rises 1 metre in 89. A 30-foot wave breaks about 450 metres inside the takeoff zone, on ground more than twice as steep, 1 in 37.
The photographs used to calibrate the game agree. The clean barrels came on the mid-size sets, about four to five rider heights tall. The biggest waves, seven to eight rider heights, stood up as walls with a throwing shoulder.
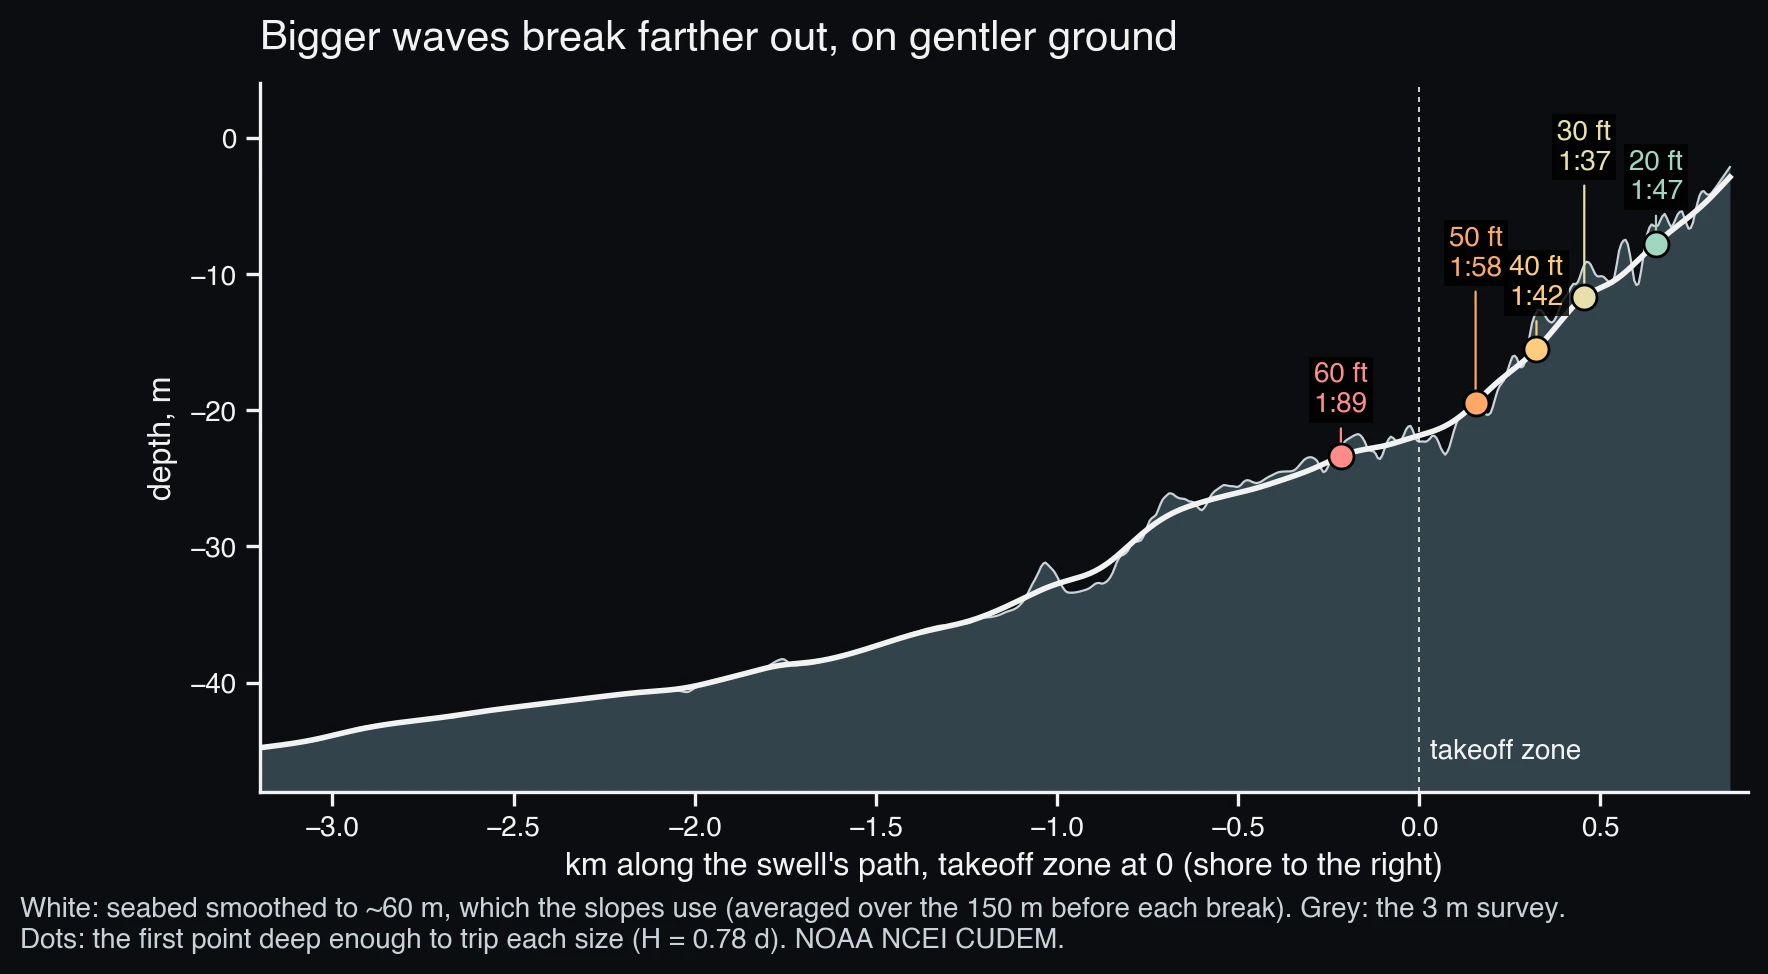
| Face | Breaks in | Bottom slope | Surf similarity ξ |
|---|---|---|---|
| 20 ft | 7.8 m | 1:47 | 0.23 |
| 30 ft | 11.7 m | 1:37 | 0.23 |
| 40 ft | 15.6 m | 1:42 | 0.18 |
| 50 ft | 19.5 m | 1:58 | 0.12 |
| 60 ft | 23.4 m | 1:89 | 0.07 |
The math: the surf similarity number, and where it fails
Battjes' surf similarity parameter compares the bottom slope with the wave's steepness:
By that number every size at Mavericks should spill, and Mavericks plunges. The number was fit to waves on plane laboratory beaches, where contours run straight and the crest meets them square. At Mavericks the crest arrives over a ridge, bends onto it and converges, which the next two sections show. The trend in the table holds up: smaller waves meet steeper ground and get the higher ξ. The threshold for plunging does not transfer to this reef.
The slopes come from the seafloor model smoothed to about 60 metres, because waves this long do not respond to smaller features. The unsmoothed survey has steps of a few metres that the smoothing hides.
6 · Refraction
Refraction concentrates the swell on the reef
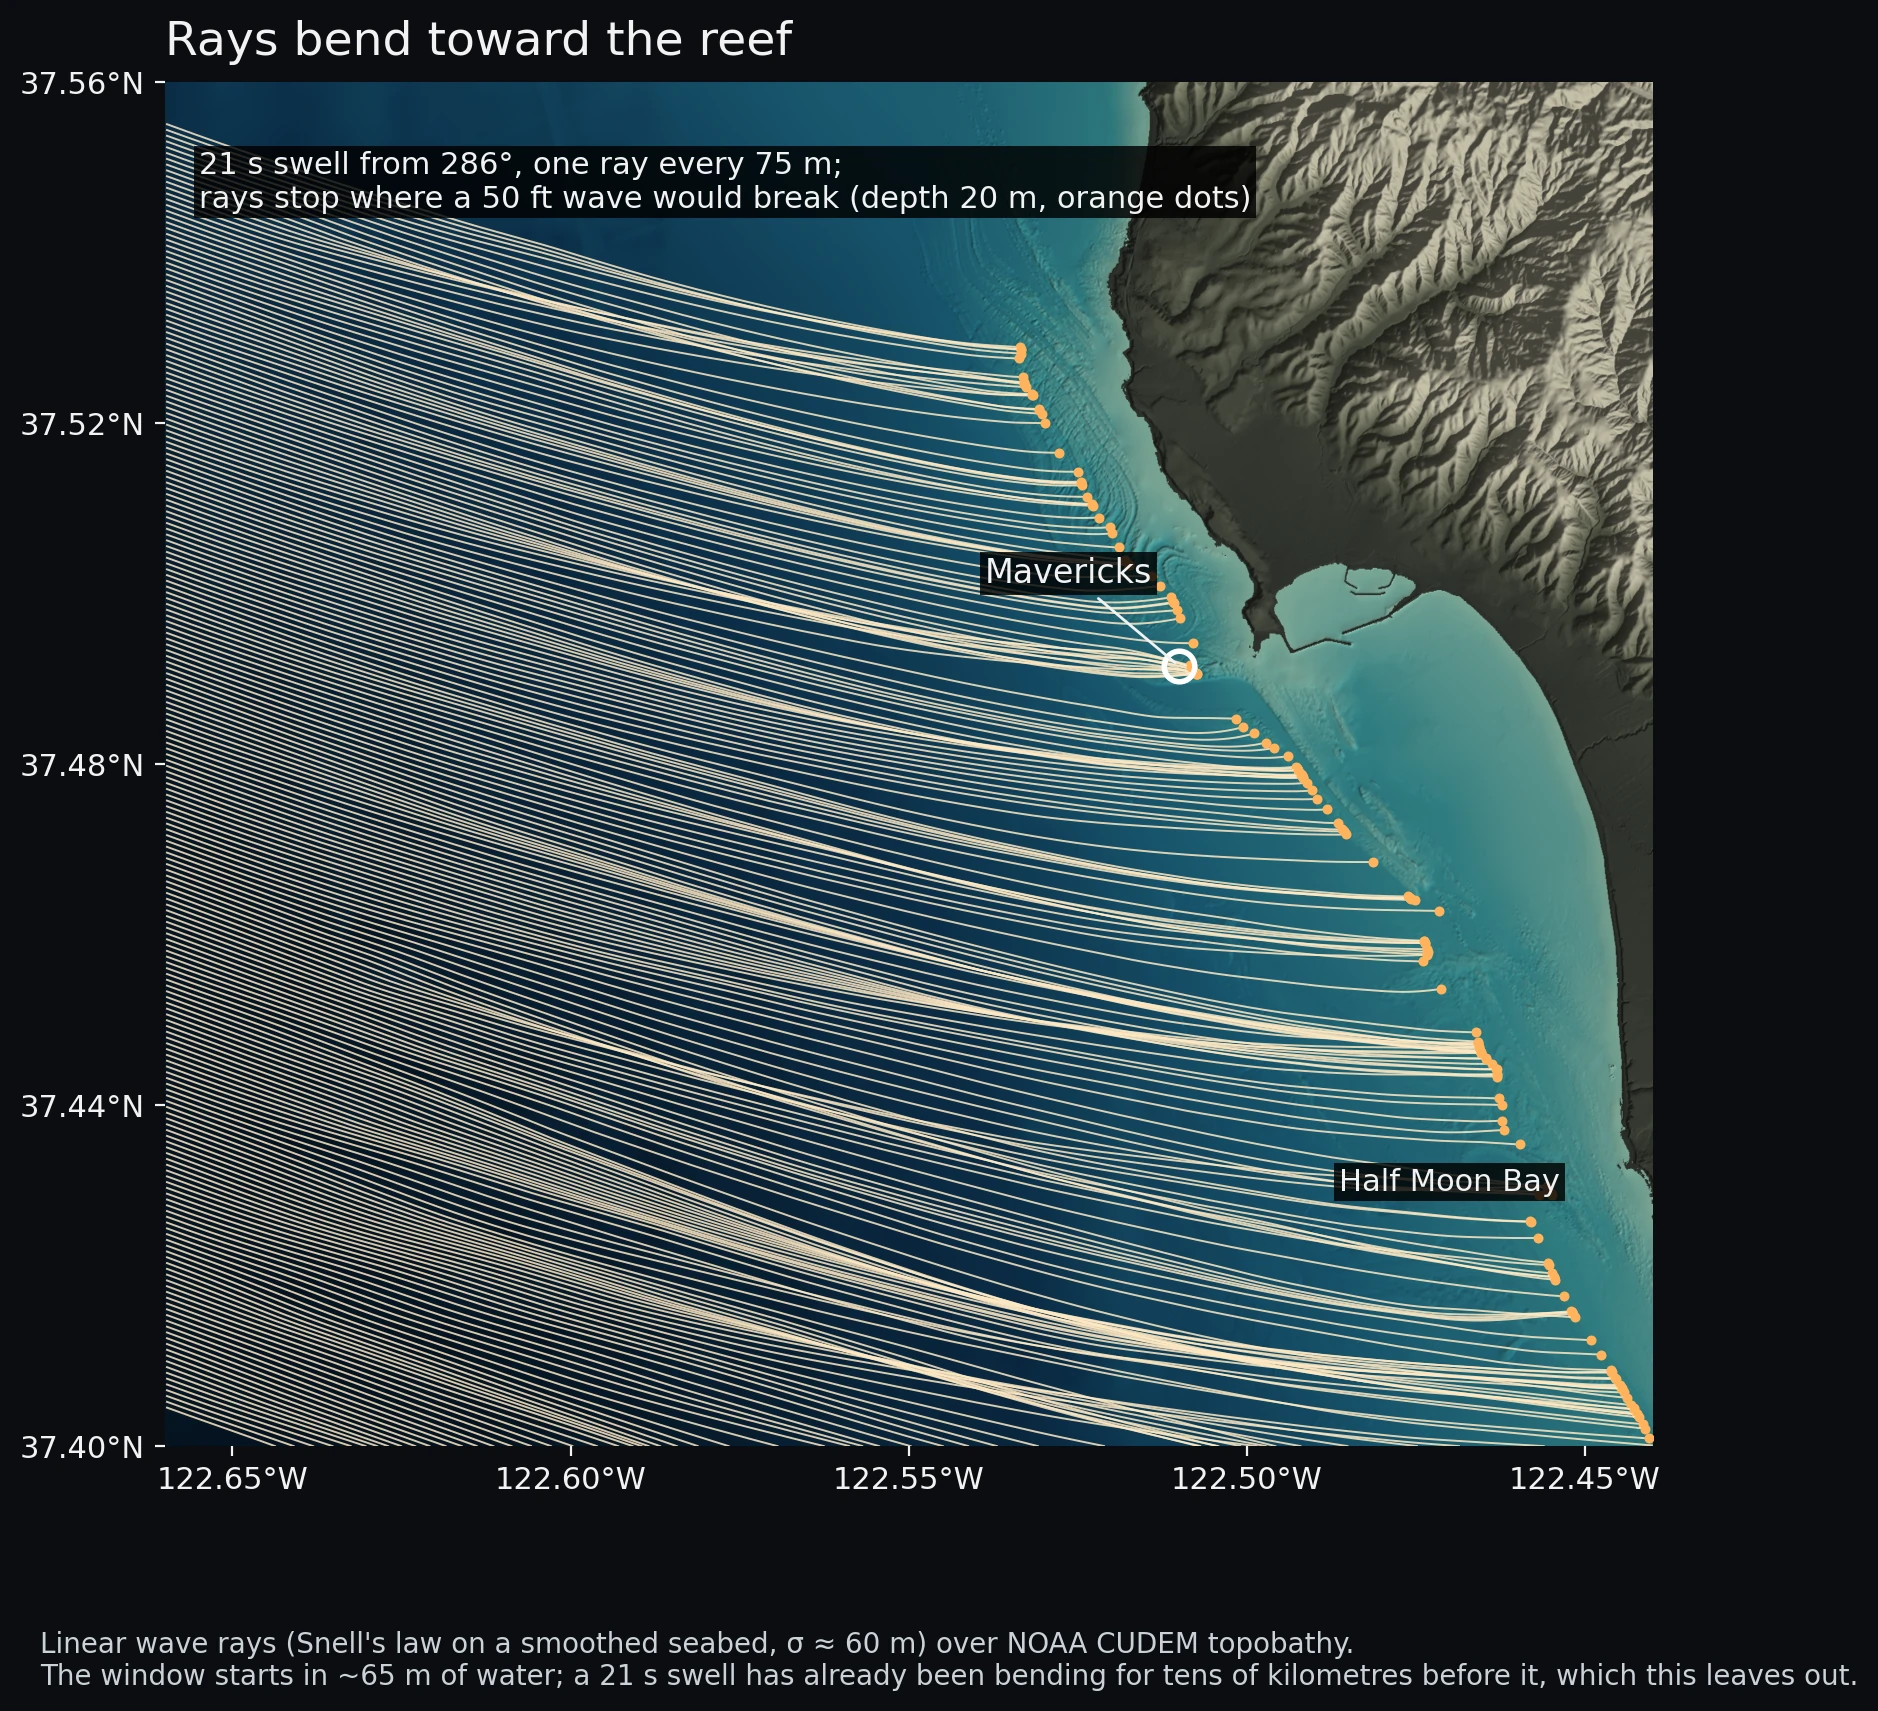
Wave speed depends on depth, so a crest crossing uneven ground turns toward the shallows. Rays, lines drawn perpendicular to the crests, keep the wave's energy between them. Where they converge the waves grow, and where they spread the waves shrink.
Figure 6 traces a 21-second swell from 286°, the direction measured at Monterey, with one ray every 75 metres. The rays converge on the Mavericks reef and spread across the bay on either side. Near the takeoff zone they raise wave height by a median factor of 1.5. Along the rest of the coast in the window the median is 0.86, so on the same swell Mavericks breaks about 1.7 times taller than its neighbours.
The math: ray tracing
Each ray carries a direction θ that turns toward slower water:
Height scales with the square root of ray spacing, Kr = √(b₀/b). Thirteen neighbouring pairs end within 400 metres of the takeoff zone. Their median Kr is 1.5. The largest, 3.9, is where two rays cross, a caustic, where linear theory breaks down. The median of 1.5 is robust to that one value.
The window begins in about 65 metres of water. A 21-second swell has already been turning for tens of kilometres across the continental shelf before that, and this trace starts every ray from the same direction. It shows only the reef's own focusing.
7 · The break line
The break line and the peel
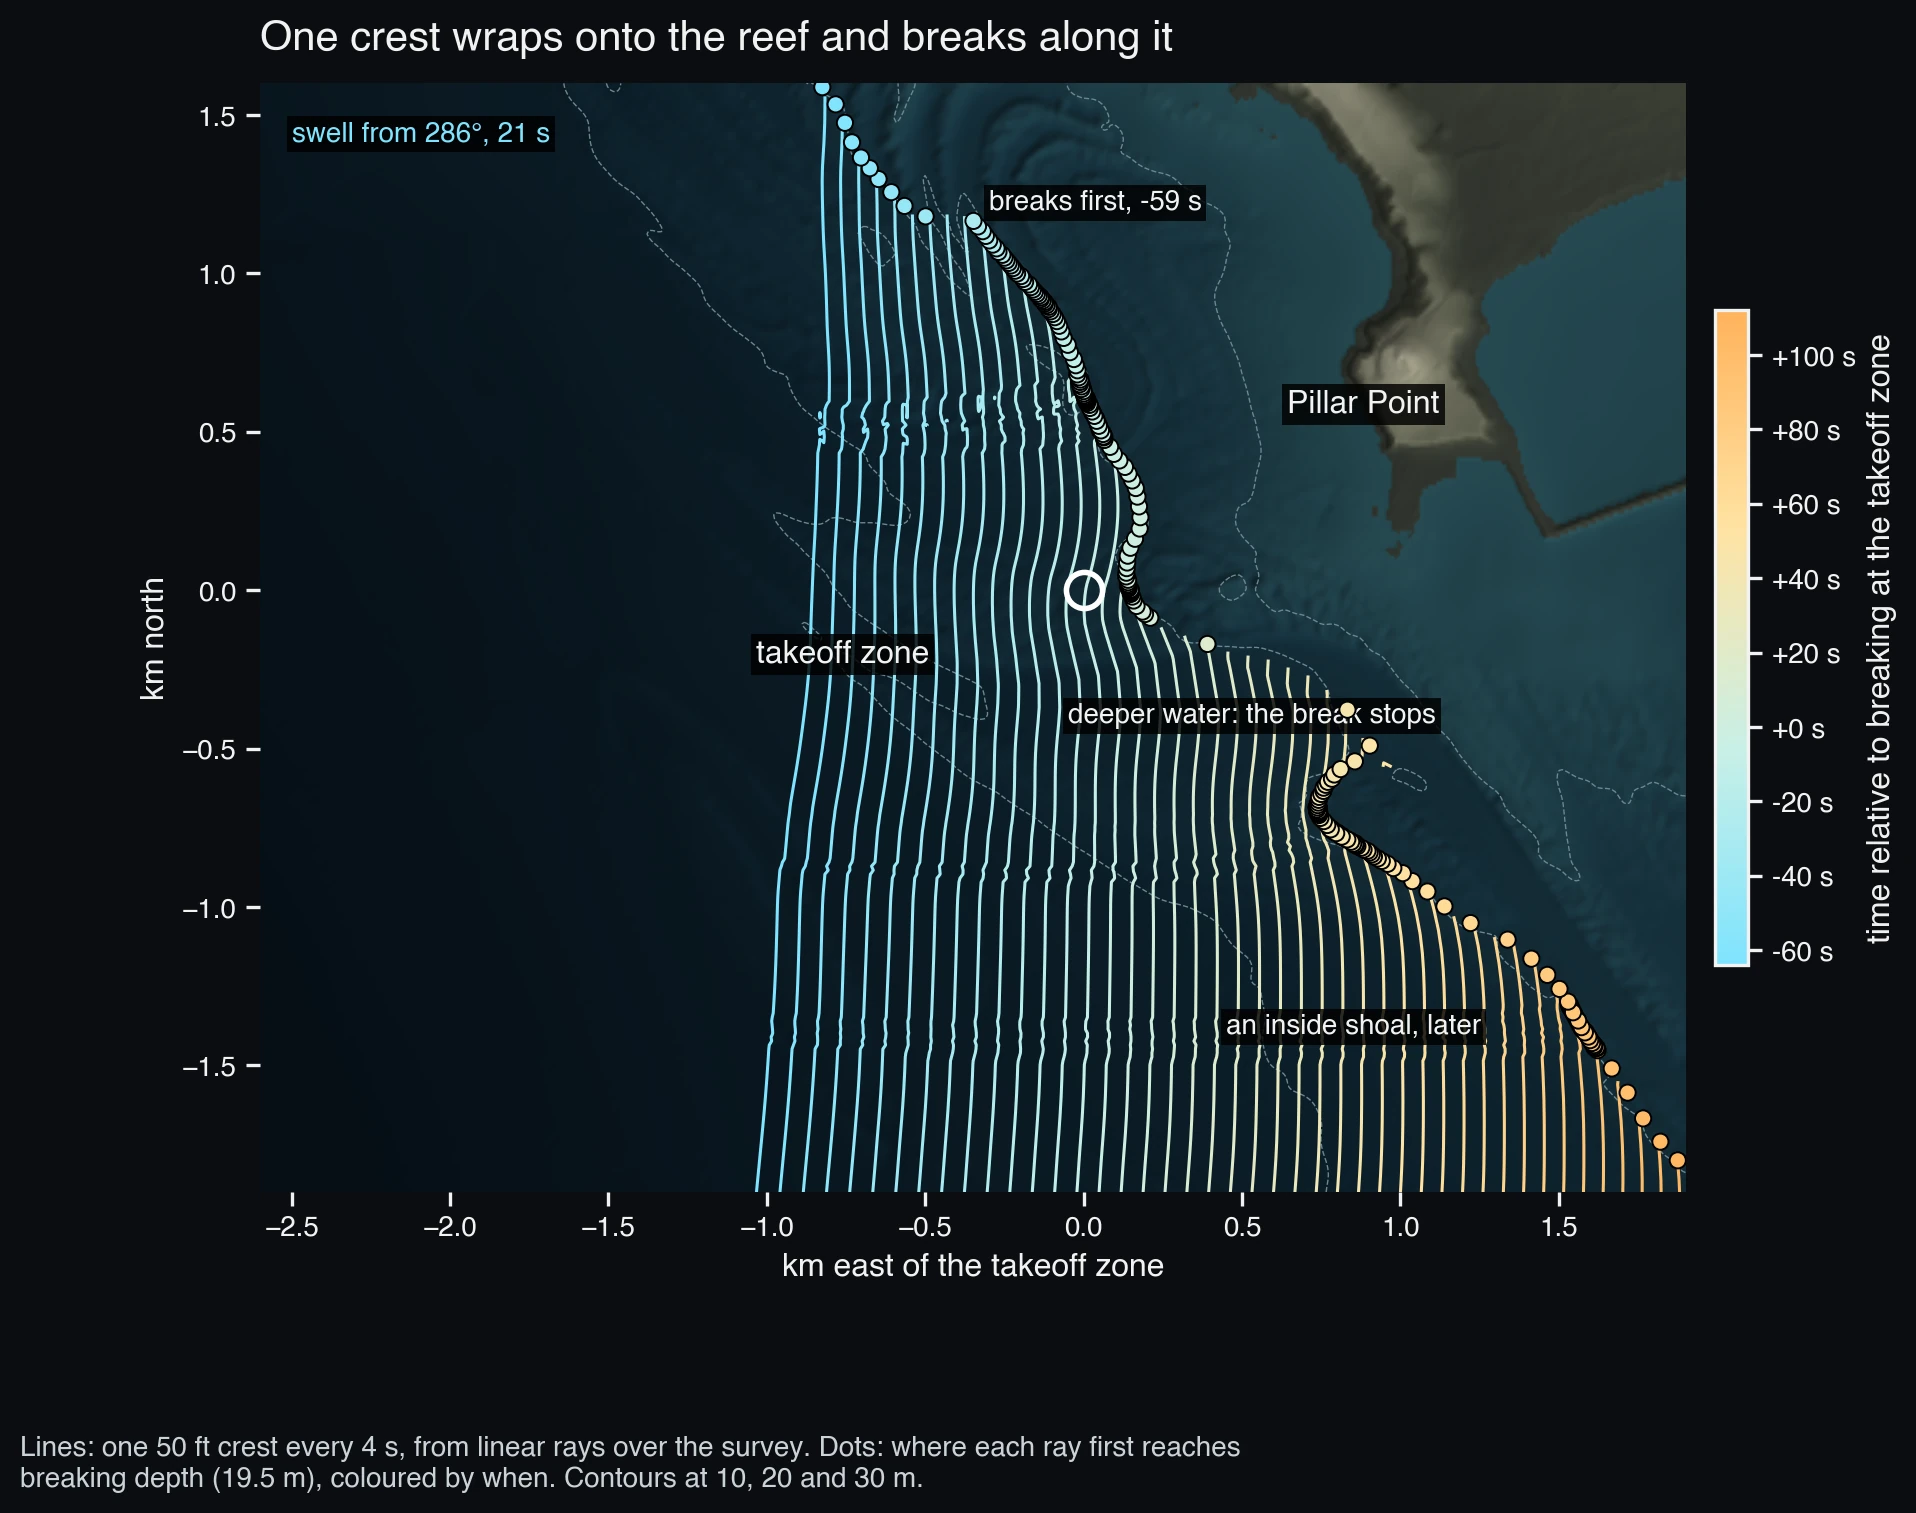
Over the reef a crest slows in the middle while its ends run ahead, so it bends around the ridge before it breaks.
For a 50-foot wave from 286°, breaking starts on the outer reef north of the takeoff zone and runs south along the reef edge, reaching the takeoff zone about a minute later. Its speed depends on the swell's exact direction. Across the directions the buoy reported that morning, 280° to 303°, it runs between 21 and 30 metres a second. Where the reef ends the bottom drops away and the break stops, so the model's ride is a long, fast right that ends in deeper water south-east of the takeoff. An inside shoal breaks later and separately.
The math: peel speed and angle
The break point moves along the break line at the peel speed Vp. With the crest moving at phase speed c and meeting the break line at angle α,
A least-squares fit of breaking time against position along the 1,680 metres north of the takeoff zone, repeated for each direction the buoy reported:
| Swell from | Peel speed | Peel angle α | Fit r |
|---|---|---|---|
| 280° | 29 m/s | 28° | 0.98 |
| 286° | 30 m/s | 27° | 0.95 |
| 293° | 22 m/s | 38° | 0.96 |
| 300° | 21 m/s | 41° | 0.99 |
| 303° | 30 m/s | 27° | 0.94 |
A few degrees of swell direction moves the peel angle by more than ten degrees. Lower angles mean faster, closer-to-closeout sections. Right at the takeoff zone the fit is noisier still, so the essay reports the range north of it.
Crest lines are contours of arrival time built from the rays, and the break line is the first point on each ray shallower than the breaking depth. Where rays cross, the break line jitters, and the fit averages over it.
8 · Limits
Limits
- The wave model is linear: one period, one direction, no currents or wind, and a breaking rule that ignores the waves breaking ahead. It shows where the reef puts energy and when crests reach breaking depth. It does not shape a lip.
- The takeoff zone comes from the 2007 description, "the bedrock reef just to the east of Sail Rock", matched to the shape of the seafloor model, without a survey point.
- The seafloor is smoothed to about 60 metres for the rays and slopes. Steps smaller than that, which a surfer would feel, are left out on purpose.
- The storm's track and footprint come from a weather model's analyses.
- Face heights from photographs and trough-to-crest heights from buoys are different measurements. The 57-foot figure is the expected largest wave from the buoy's statistics, not a measured wave at the reef.
Also in the game
Pe'ahi and Cortes Bank
El Niño Surfer also has Pe'ahi on Maui and Cortes Bank off San Diego, set on big days we imagined for this winter. Whether the winter delivers them is open.
Sources
Data and references
- NOAA National Data Buoy Center, realtime spectral wave data, stations 46059 and 46042, 10–18 November 2026 (ndbc.noaa.gov), read 20 November 2026.
- NOAA NCEP, GFS and GFS-Wave 0.25° analyses, 11–15 November 2026, from the NOAA Open Data Dissemination archive (registry.opendata.aws/noaa-gfs-bdp-pds).
- NOAA NCEI, Continuously Updated Digital Elevation Model (CUDEM), 1/9 arc-second topobathy, tiles ncei19_n37x50_w122x50 and ncei19_n37x50_w122x75 (2022), via NCEI's elevation services.
- NOAA Climate Prediction Center, ENSO Diagnostic Discussion, 12 November 2026 (PDF), and the relative and traditional Oceanic Niño Index tables, read 20 November 2026.
- Bromirski, P. D., Cayan, D. R., & Flick, R. E. (2005). Wave spectral energy variability in the northeast Pacific. Journal of Geophysical Research: Oceans, 110. doi:10.1029/2004JC002398
- Barnard, P. L., et al. (2015). Coastal vulnerability across the Pacific dominated by El Niño/Southern Oscillation. Nature Geoscience, 8, 801–807. doi:10.1038/ngeo2539
- Barnard, P. L., et al. (2017). Extreme oceanographic forcing and coastal response due to the 2015–2016 El Niño. Nature Communications, 8. doi:10.1038/ncomms14365
- Sanctuary Integrated Monitoring Network (2007). High-resolution mapping of Mavericks. sanctuarysimon.org
- Bowyer, P. J., & MacAfee, A. W. (2005). The theory of trapped-fetch waves with tropical cyclones: an operational perspective. Weather and Forecasting, 20, 229–244. doi:10.1175/WAF849.1
- Barber, N. F., & Ursell, F. (1948). The generation and propagation of ocean waves and swell. I. Wave periods and velocities. Philosophical Transactions of the Royal Society A, 240, 527–560. doi:10.1098/rsta.1948.0005
- Longuet-Higgins, M. S. (1952). On the statistical distribution of the heights of sea waves. Journal of Marine Research, 11, 245–266.
- Battjes, J. A. (1974). Surf similarity. Coastal Engineering Proceedings, 14. doi:10.9753/icce.v14.26
- Munk, W. H., & Traylor, M. A. (1947). Refraction of ocean waves: a process linking underwater topography to beach erosion. The Journal of Geology, 55(1). doi:10.1086/625388
- Fenton, J. D., & McKee, W. D. (1990). On calculating the lengths of water waves. Coastal Engineering, 14, 499–513. doi:10.1016/0378-3839(90)90032-R
- McCowan, J. (1894). On the highest wave of permanent type. Philosophical Magazine, Series 5, 38, 351–358.
Surf reports for the day (faces of 40 to 60 feet, tow-in only) are from SURFER, the San Francisco Chronicle and The Inertia, 16–19 November 2026. DOIs were checked against Crossref on 20 November 2026.